Data visualization - nsduh companion infographics
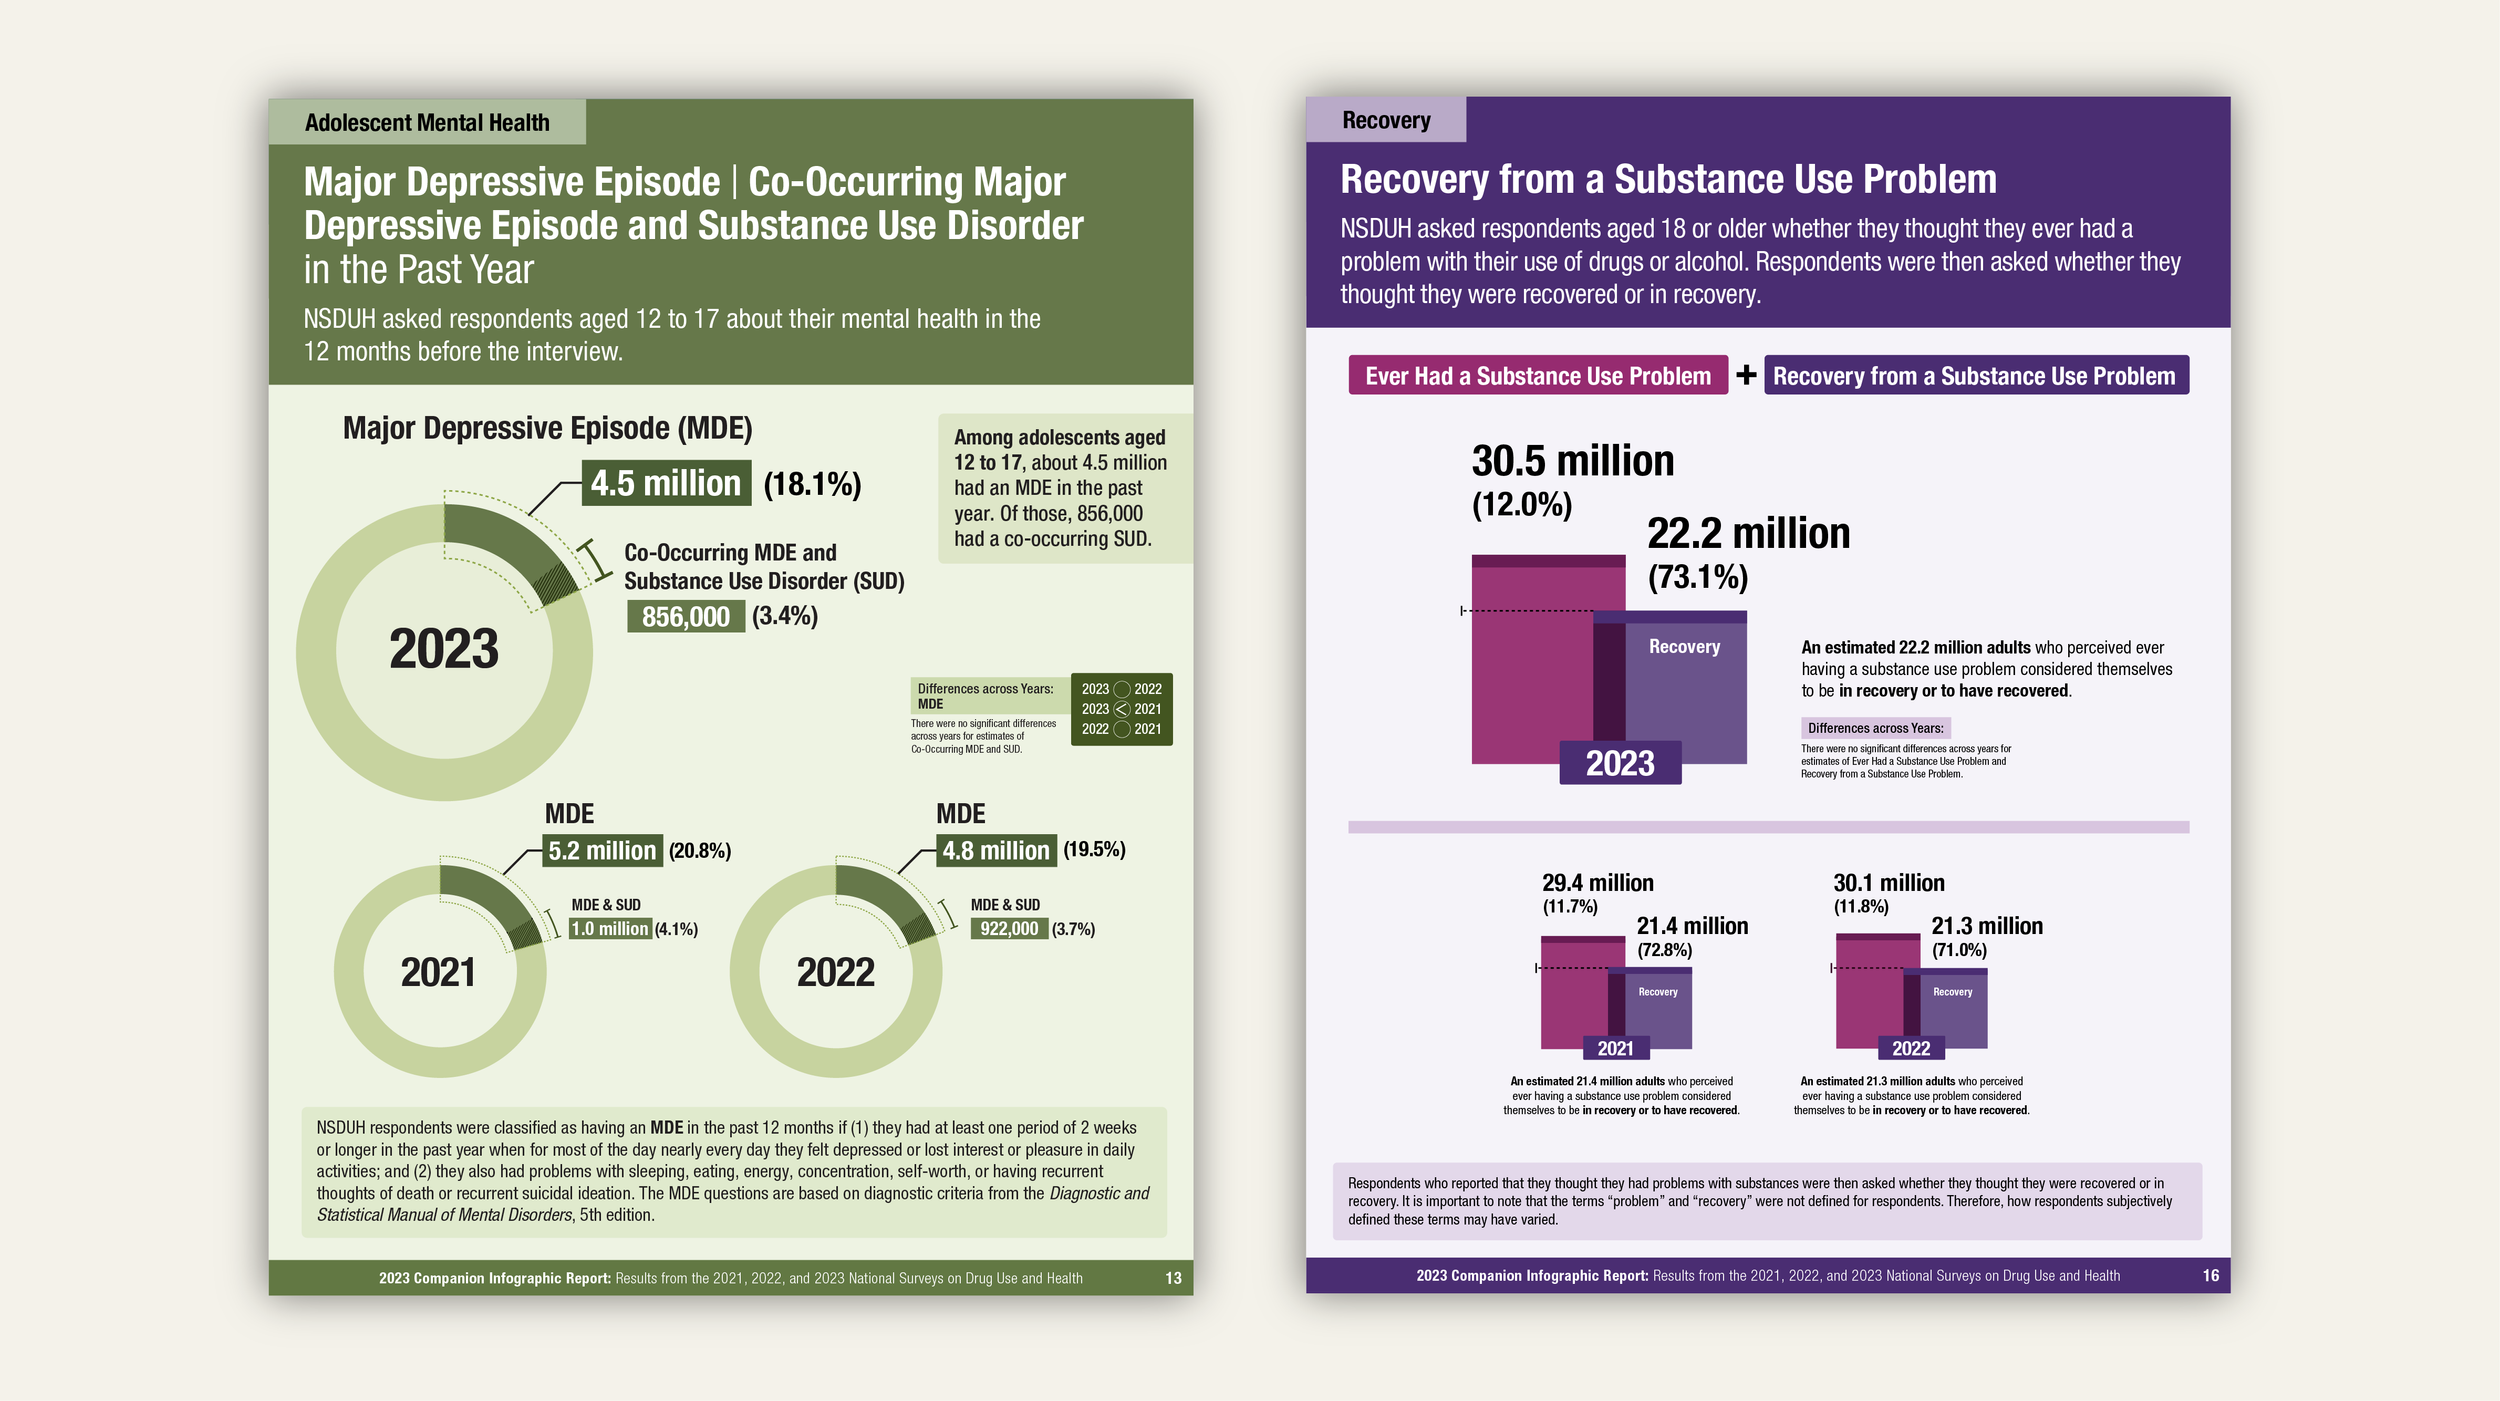
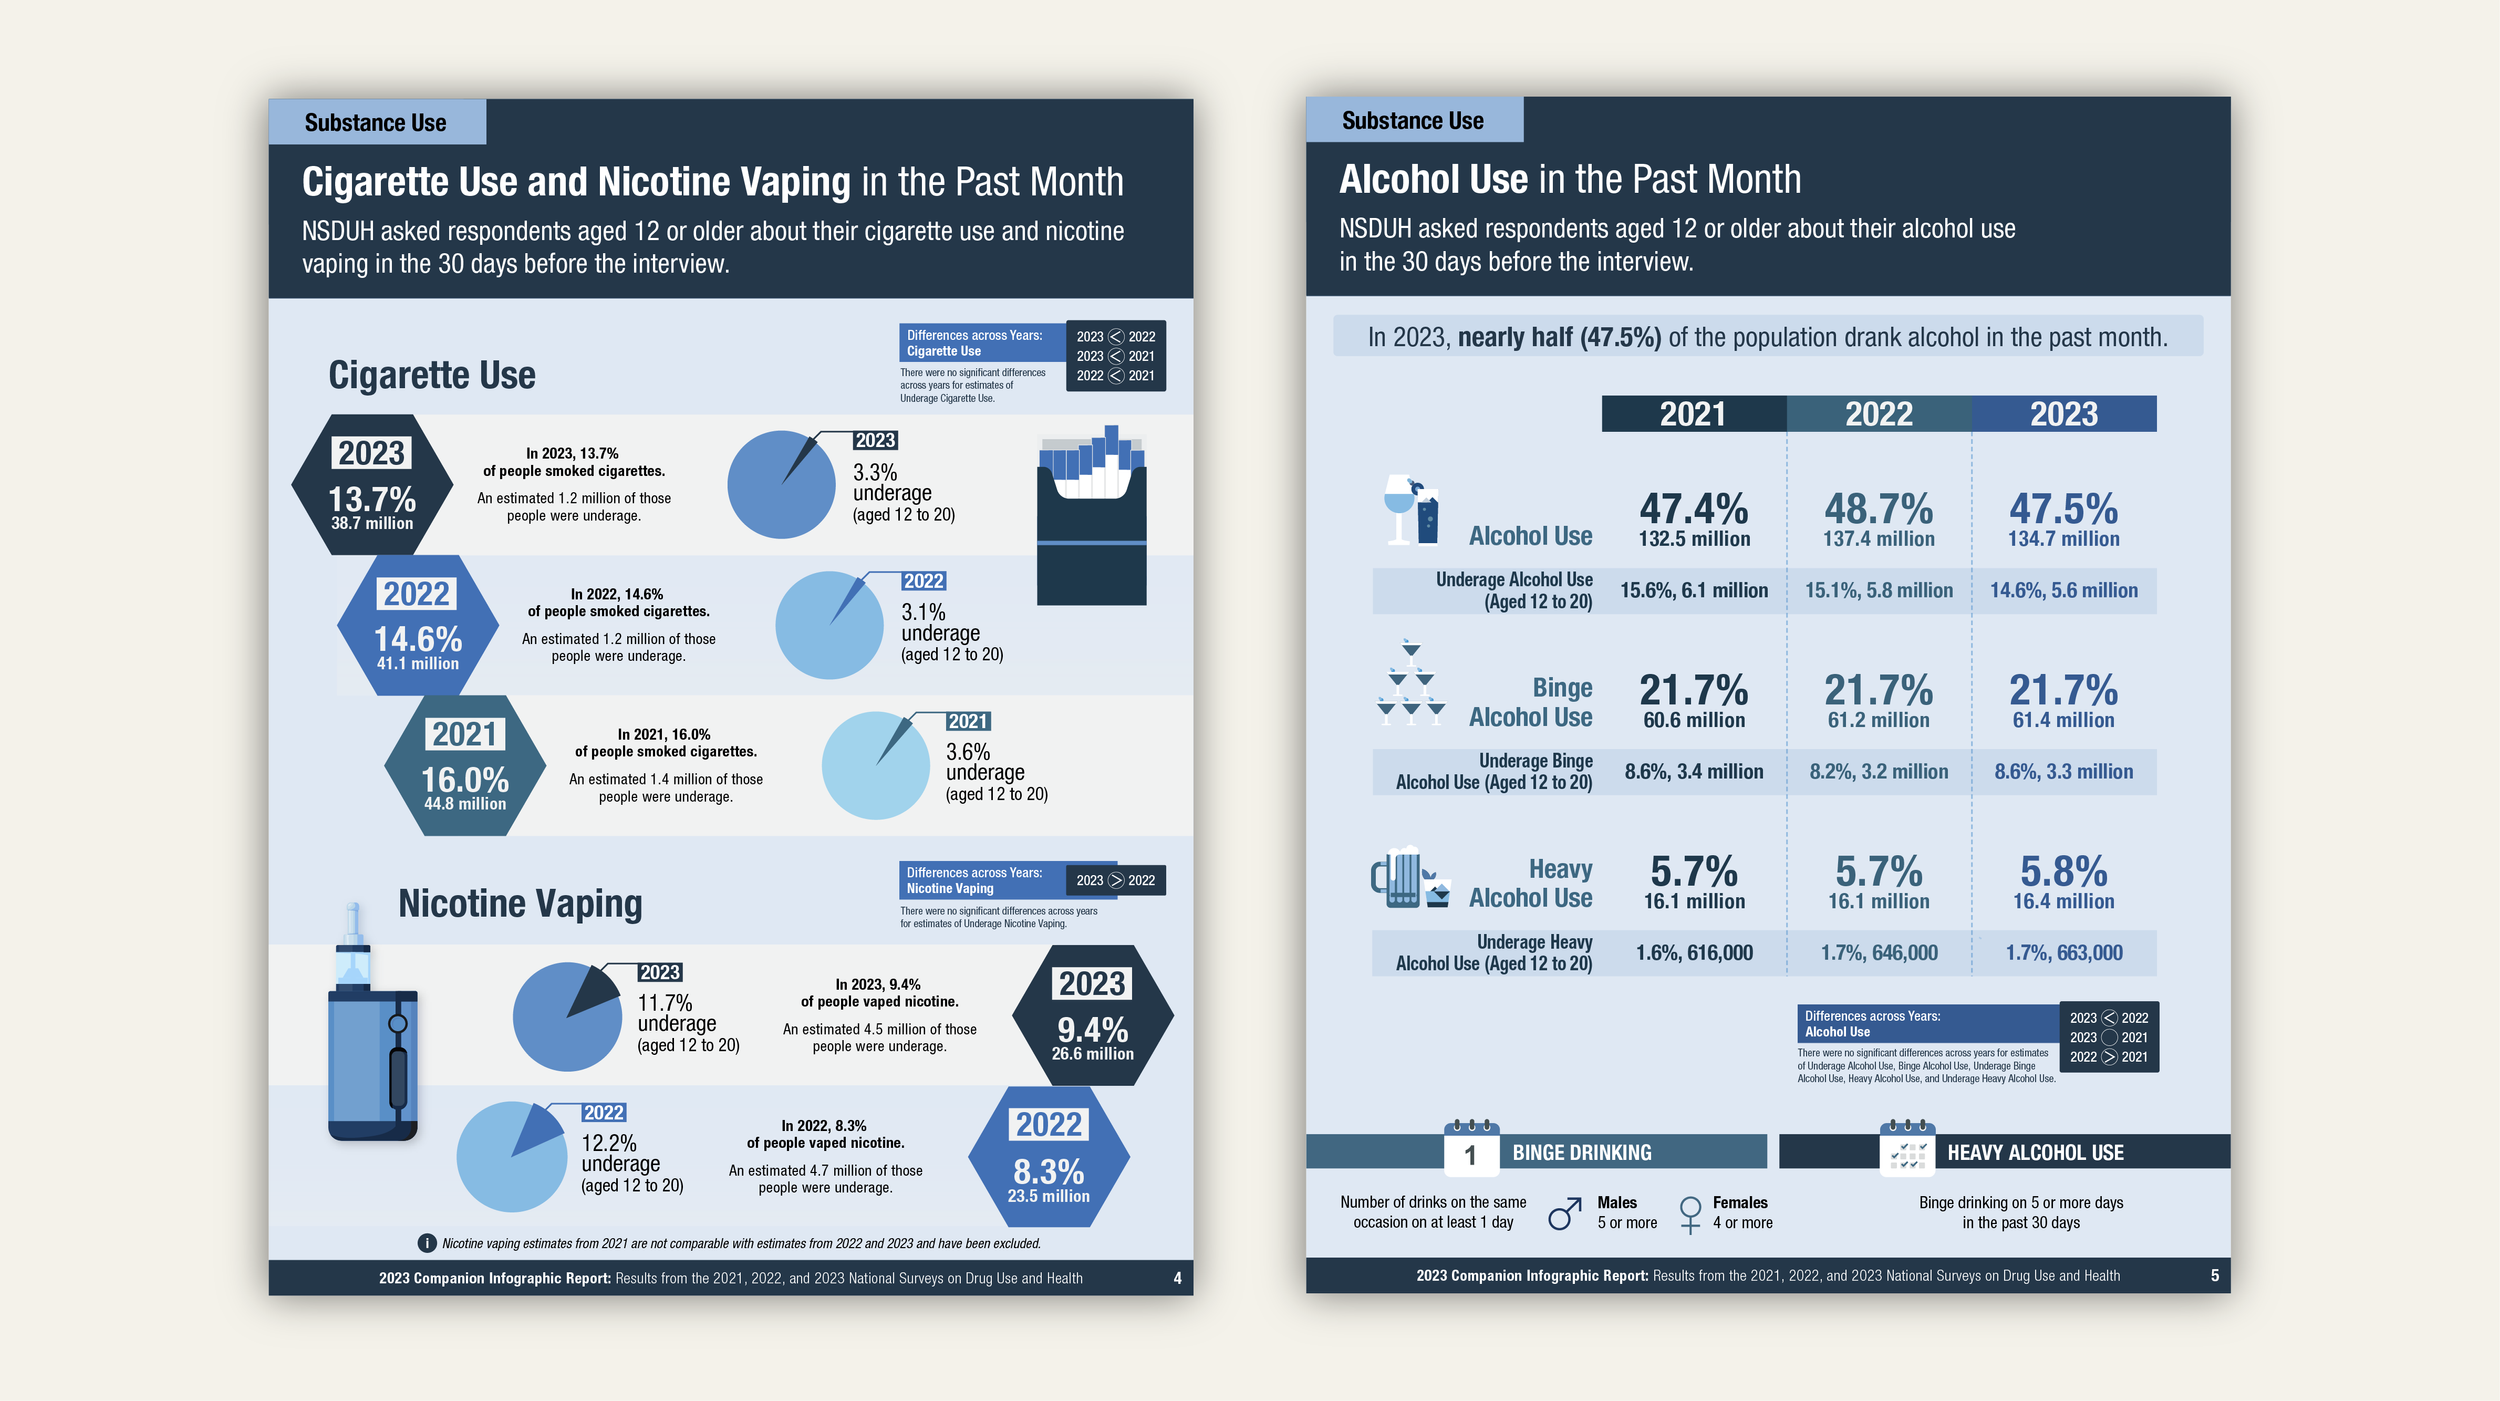
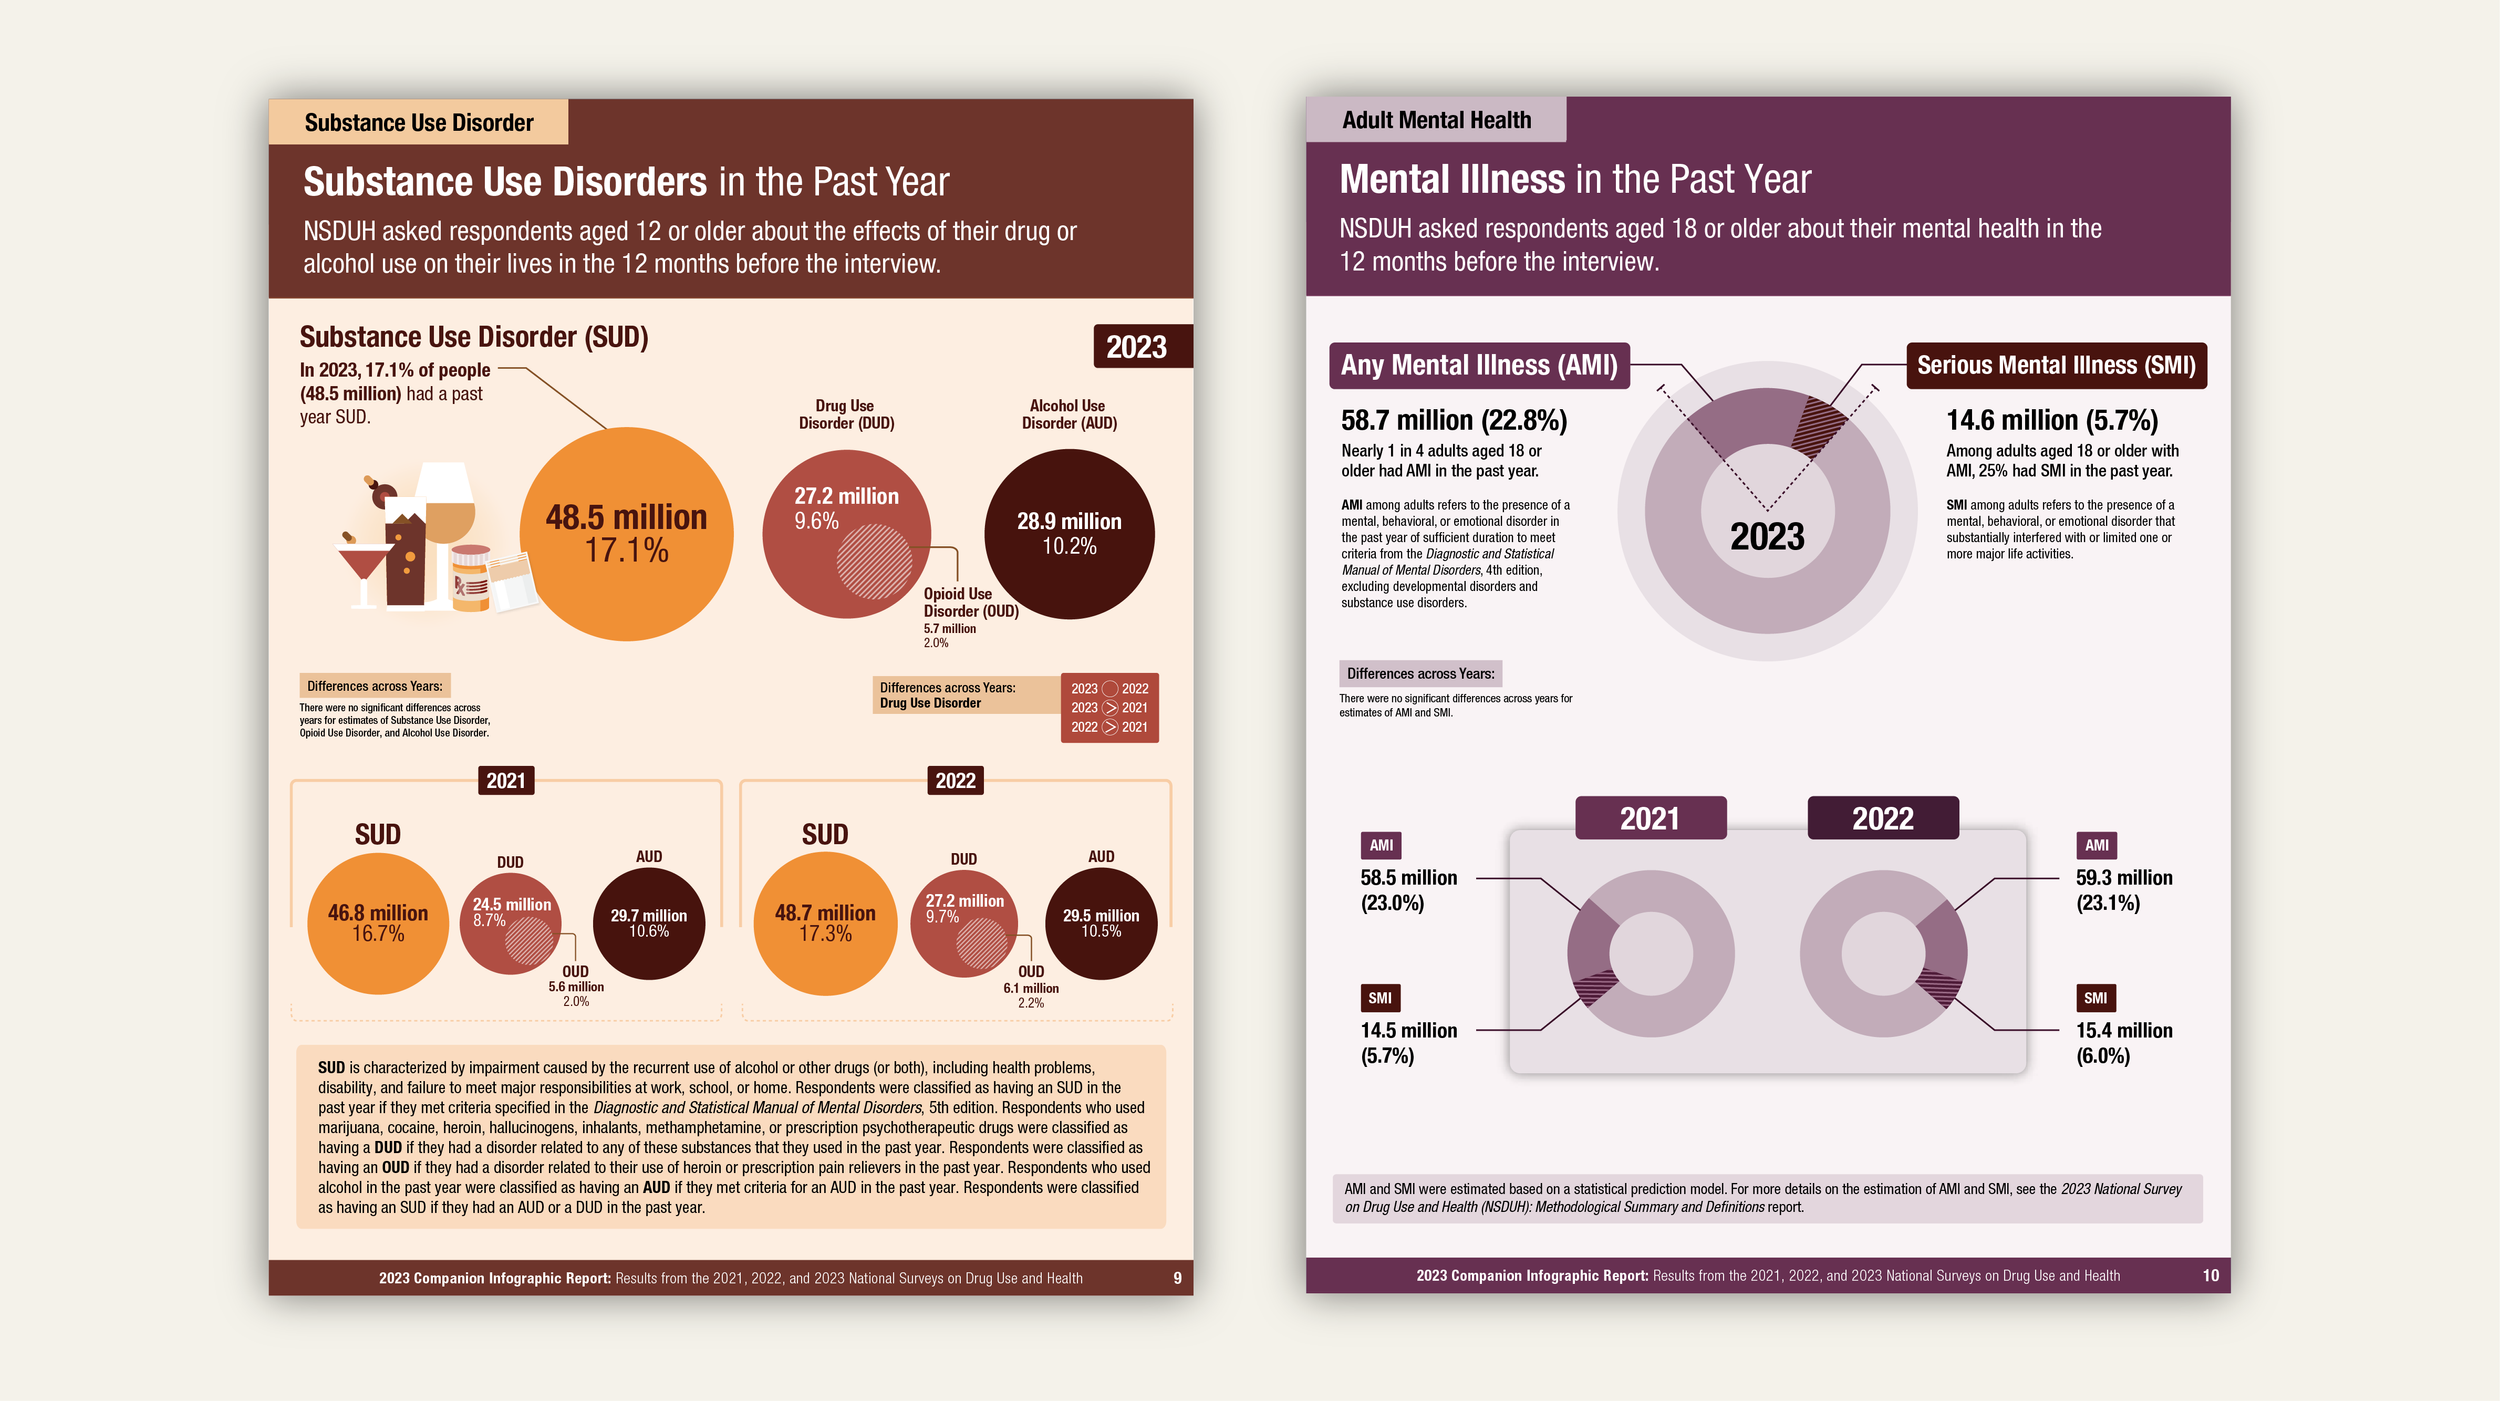
This infographic, which goes along with the 2023 NSDUH National Report, looks at substance abuse, substance use disorders, mental health issues, thoughts of suicide, and how people feel about recovering from these problems among people aged 12 and older in the U.S. who aren't living in institutions.
We transformed raw data into visually appealing, accurate, and cohesive infographics, featuring a variety of graphs like bar charts, pie charts, combined circle charts, and other types of diagrams. These showcase my ability to take complex data and turn it into something more easily understandable.